1) Penman-Monteith model

Penman-Monteith模型
1.
Based on the Bowen ratio energy balance(BREB) measurements during 2004~2005 entire maize growing season,the performance of hourly and daily evapotranspiration(ET) was estimated by both the Shuttleworth-Wallace model and the Penman-Monteith model.
根据夏玉米生长季内逐时波文比系统观测资料和主要生育期的作物资料,以波文比-能量平衡法(BREB法)得到的蒸散量为实测值,对比研究了Shuttleworth-Wallace模型(以下简称S-W模型)、Penman-Monteith模型(以下简称P-M模型)对蒸散估计的差异。
2) Monteith-Penman model
Monteith-Penman模型
3) FAO Penman-Monteith model
FAO Penman-Monteith模型
4) Penman-Monteith evapotranspiration model
Penman-Monteith蒸散模型
5) Penman-Monteith formula
Penman-Monteith公式
1.
Influence of e_a on calculation of reference crop evapotranspiration with Penman-Monteith formula;
不同e_a计算方法对Penman-Monteith公式的影响
2.
The consult crops water demand ETO of every month (5~9 month) in ten years is calculated with Penman-Monteith formula.
根据抚顺地区3个气象站10年的气象资料,应用Penman-Monteith公式计算了10年来每年(5~9月)各月的参考作物需水量ET0,分析了ET0的月际变化和年际变化特征,同时分析了各气象因素对ET0的影响。
6) Penman-Monteith equation
Penman-Monteith公式
1.
Changes of reference crop evapotranspiration(ET0) and its causes were analyzed by the computed ET0 using Penman-Monteith equation which was recommended by FAO according to weather data of 41 years for 30 weather stations in Guanzhong Region of Shaanxi Province(Central Shaanxi Plain).
根据关中地区30个气象站41年的气象资料,采用FAO推荐的Penman-Monteith公式计算参考作物蒸发蒸腾量(ET0),分析了陕西关中地区ET0的变化及原因,结果表明,从长期来看,关中地区ET0在减少趋势的基础上表现出周期性变化,从阶段性来看,1980年之前和之后则主要表现为增加趋势。
2.
Based on the meteorological data collected from 3 stations in recent 10 years in Fushun region,the reference crop evapotranspiration(ET_0) was calculated with the Penman-Monteith equation recommended by FAO in 1990.
根据抚顺地区3个气象站的气象观测资料,应用1990年联合国粮农组织推荐的Penman-Monteith公式计算各站1995~2004年10年来的参考作物需水量ET0。
3.
Based on daily meteorological data from 1989 to 1996 of Aksu Water Balance Experimental Station, CAS in Alaer irrigated area in Tarim river basin, daily reference crop evapotranspirations are calculated by Penman-Monteith equation.
利用Penman-Monteith公式,根据阿克苏水平衡试验站1989~1996年逐日气象资料,计算了逐日参考作物潜在腾发量,分析了其变化特征,建立了其与其它气象要素、20cm蒸发皿蒸发量的相关关系。
补充资料:AutoCad 教你绘制三爪卡盘模型,借用四视图来建模型
小弟写教程纯粹表达的是建模思路,供初学者参考.任何物体的建摸都需要思路,只有思路多,模型也就水到渠成.ok废话就不说了.建议使用1024X768分辨率
开始
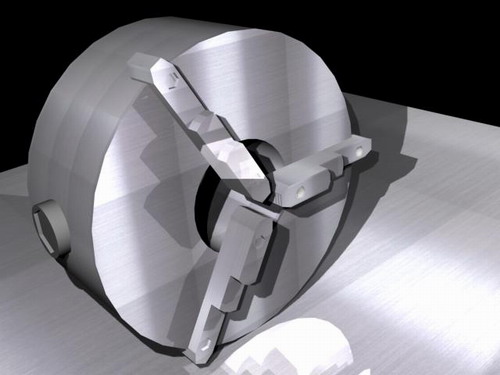
先看下最终效果
第一步,如图所示将窗口分为四个视图
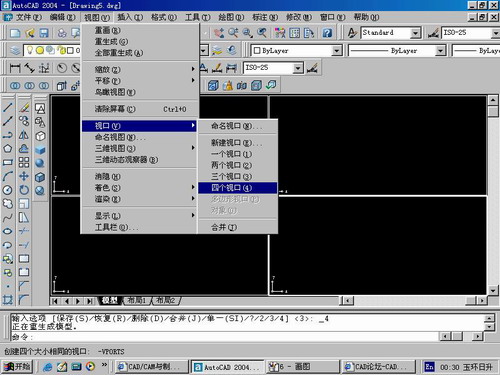
第二步,依次选择每个窗口,在分别输入各自己的视图
第三步,建立ucs重新建立世界坐标体系,捕捉三点来确定各自的ucs如图

第四步,初步大致建立基本模型.可以在主视图建立两个不同的圆,在用ext拉升,在用差集运算.如图:
第五步:关键一步,在此的我思路是.先画出卡爪的基本投影,在把他进行面域,在进行拉升高度分别是10,20,30曾t形状.如图:
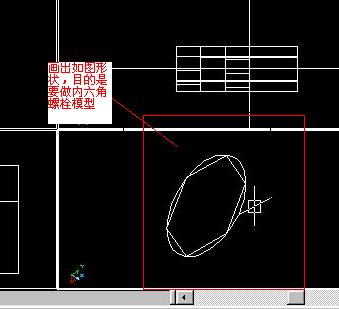
第六步:画出螺栓的初步形状.如图
第七步:利用ext拉升圆,在拉升内六边形.注意拉升六边行时方向与拉升圆的方向是相反的.
之后在利用差集运算
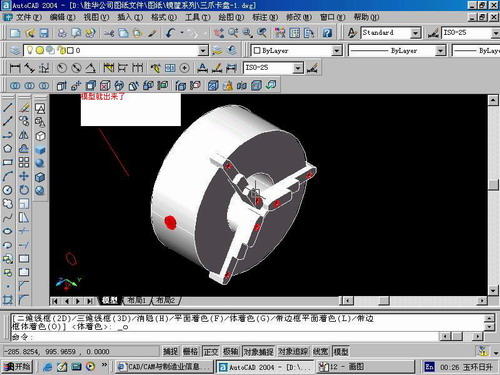
第八步:将所得内螺栓模型分别复制到卡爪上,在利用三个视图调到与卡爪的中心对称.效果如图红色的是螺栓,最后是差集
第九步:阵列
第10步.模型就完成了
来一张利用矢量处理的图片
说明:补充资料仅用于学习参考,请勿用于其它任何用途。
参考词条